What it is for#
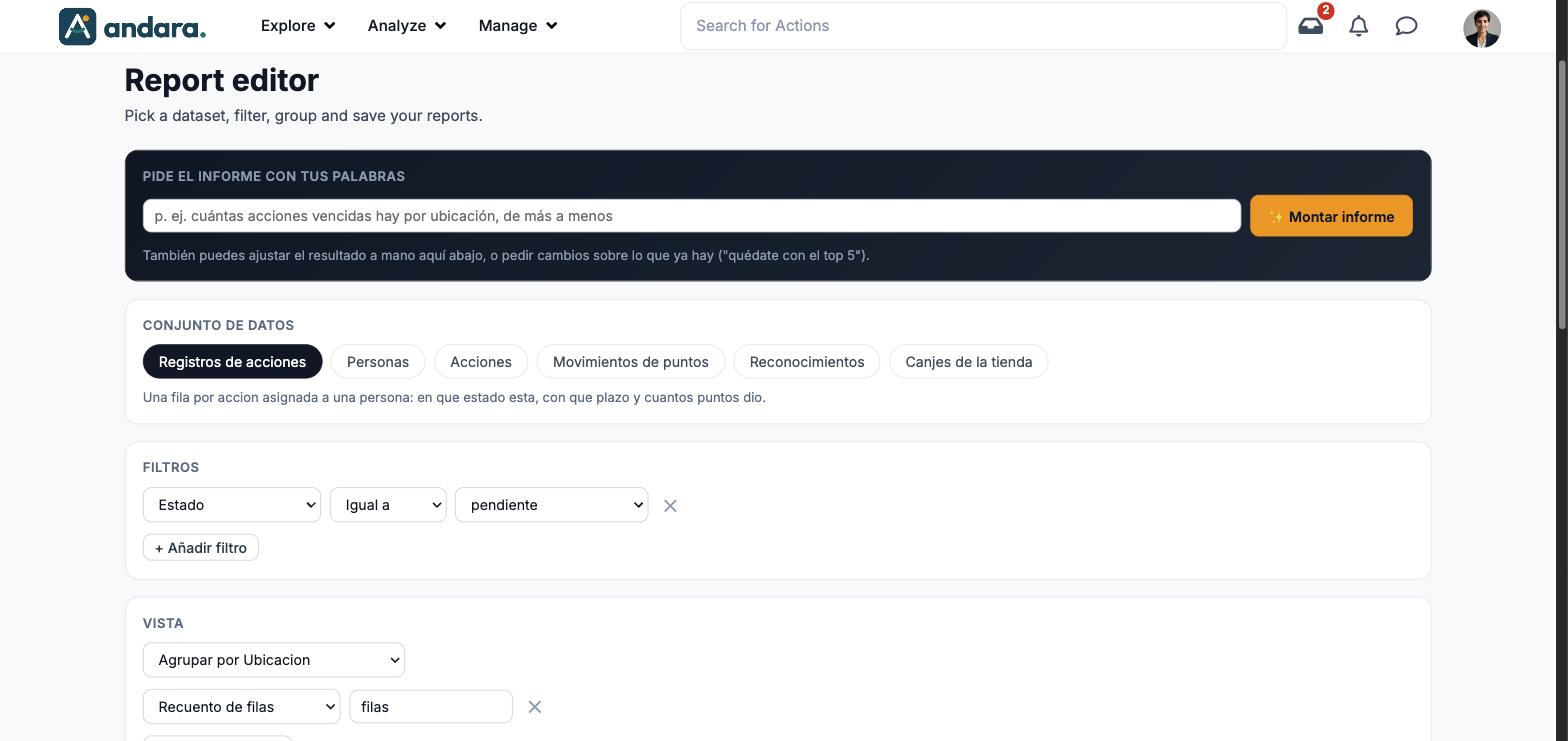
This is where you get the figure or list no panel gives you ready-made. You choose which data to start from (action records, people, actions, points movements, recognitions or store redemptions), add filters, decide whether you want detail rows or groups with a count or a sum, and run it. The result exports to CSV and the report can be saved to run again.
You can also ask for it in your own words and let the app build the configuration for you.
Apart from the title and subtitle, this screen is in Spanish also when the app is in English. The labels below are written as they appear, with their meaning.
Where it is: Analyze › Report Editor.
What you see#
| Element | What it shows |
|---|---|
| Project name | At the top, the project the reports are calculated on. |
| Pide el informe con tus palabras | Ask for the report in your own words: a text box and the ✨ Montar informe (build report) button, which fills in the configuration below from what you type. |
| Conjunto de datos | Dataset: the six data sources, with a sentence explaining what each row is. |
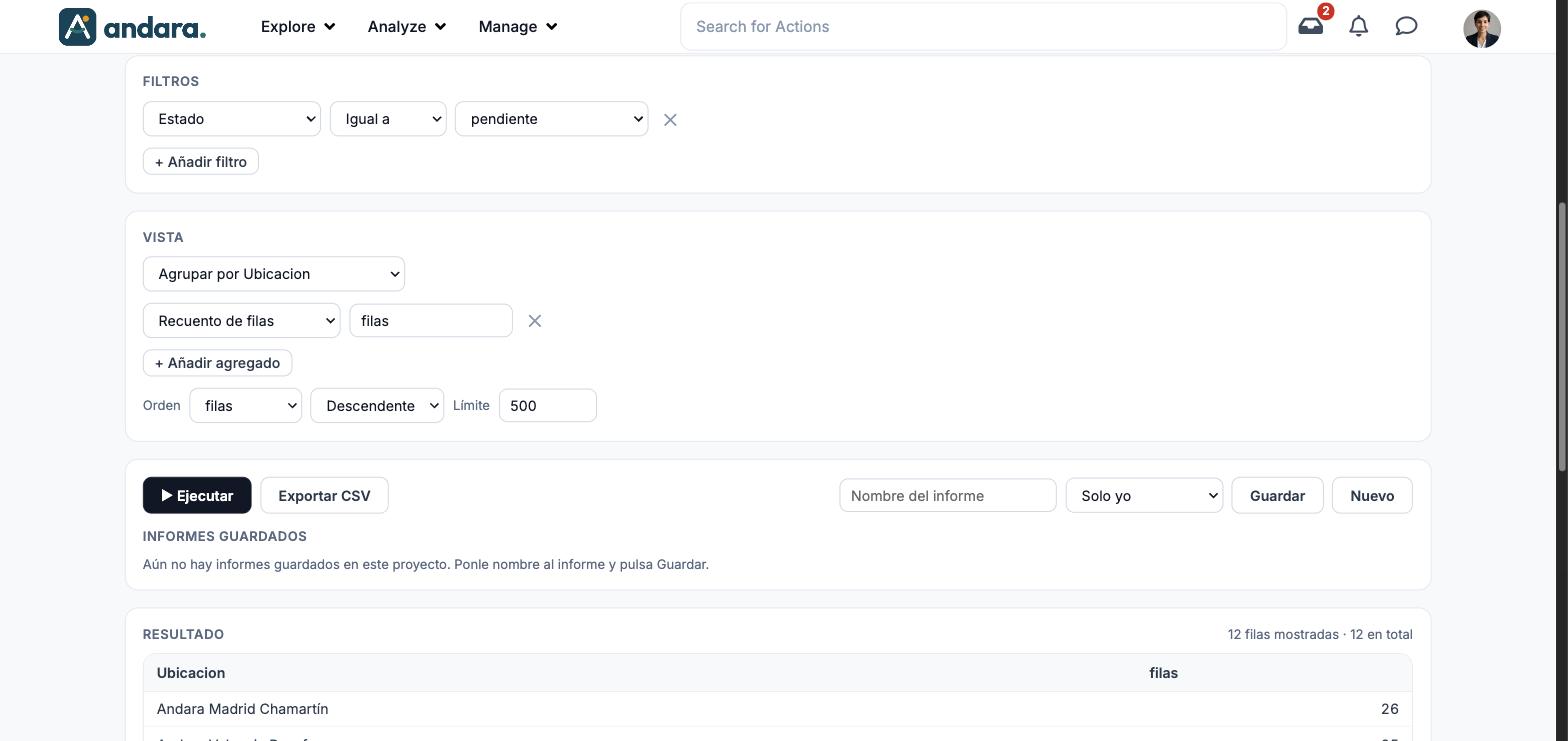
| Filtros | Filters: the conditions rows must meet, with + Añadir filtro (add filter). |
| Vista | View: grouping, aggregates, order, limit and columns. |
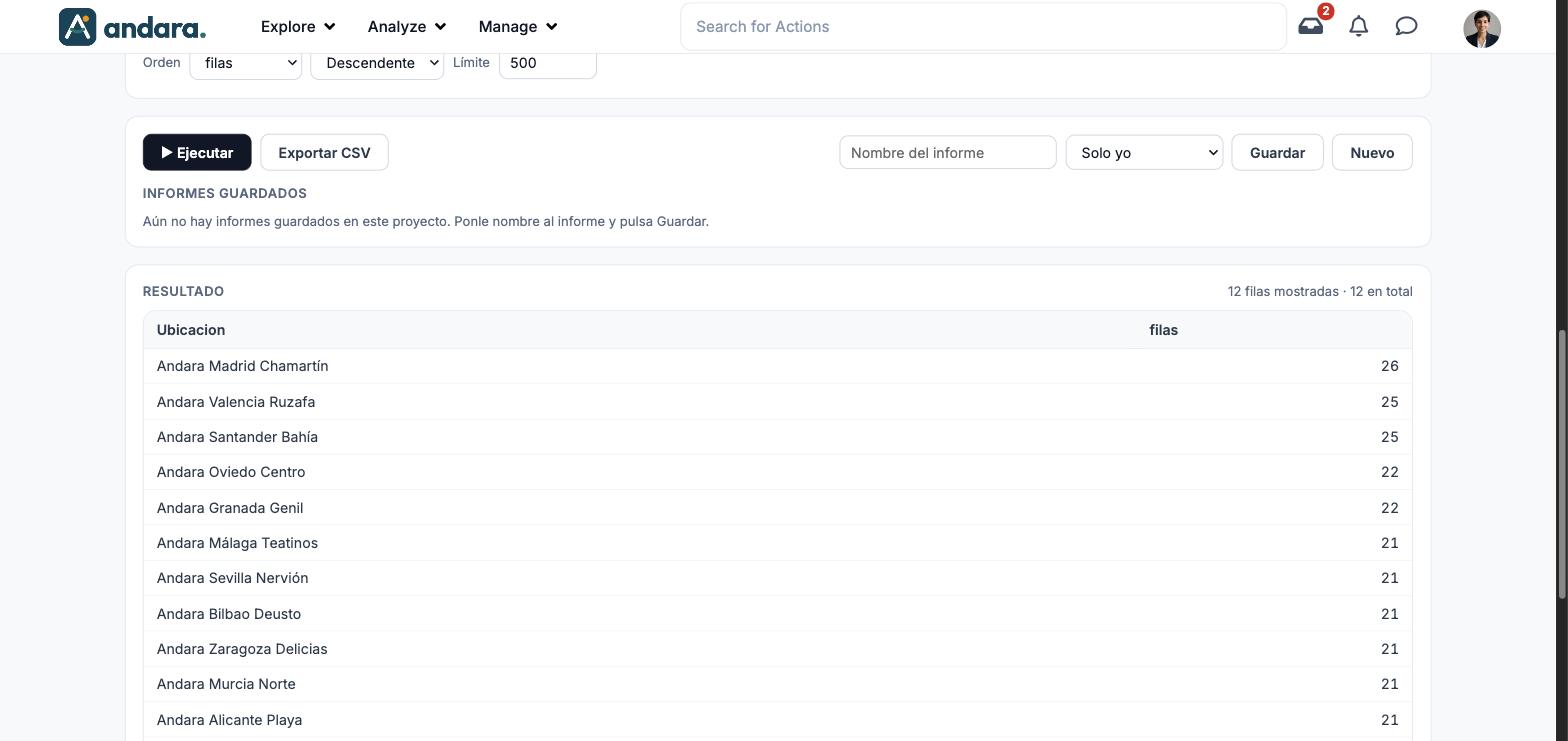
| ▶ Ejecutar | Run: calculates the report with the current configuration. |
| Exportar CSV | Export CSV: downloads the result. |
| Nombre del informe, visibility, Guardar, Nuevo | Report name, visibility, Save and New: to save the configuration and start another one. |
| Informes guardados | Saved reports in the project. Empty until you save the first one. |
| Resultado | Result: the table, with how many rows are shown out of the total. |
Settings#
Dataset#
| Dataset | What each row is | Fields to group, sort and filter by |
|---|---|---|
| Registros de acciones (action records) | One action assigned to one person: its status, deadline and the points it gave. It is the default. | Person, first name, last name, email, location, organisational unit, active person, action, active action, action group, status, assigned on, completed on, deadline, points. |
| Personas (people) | One person in the project (active and deactivated), with their activity and progress. | Person, email, job title, location, organisational unit, active, administrator, sign-up date, last activity, actions assigned, actions completed, % completed, points in the project. |
| Acciones (actions) | One action in the project, with its configuration and how many people completed it. | Action, action group, points awarded, active, archived, completion method, start date, fixed deadline, dynamic dates, optional, times assigned, times completed, % completed. |
| Movimientos de puntos (points movements) | One points movement: who, how much and why. | Person, email, points, reason, date. |
| Reconocimientos (recognitions) | One peer recognition: who gave it, who received it and with how many points. | Giver, receiver, comment, emoji, points, public, date. |
| Canjes de la tienda (store redemptions) | One store redemption: person, item, cost and order status. | Person, email, item, points, order status, cancellation requested, date. |
Filters#
Each filter is a row with three parts. Add more with + Añadir filtro and remove each one with ×.
| Field | What it does | Values |
|---|---|---|
| Field | Which column is filtered. | The fields of the chosen dataset. |
| Condition | How it compares. | Igual a (equal to), Distinto de (not equal to), Contiene (contains), Es uno de (is one of), Con valor (has a value), Sin valor (empty). Default: Igual a. |
| Value | What it is compared with. While loading it says "cargando valores…". | Drop-down with the values that exist in that field (for example, for Estado: completada, pendiente, pendiente_aprobacion). |
View#
| Field | What it does | Values |
|---|---|---|
| Grouping | Decides whether you see each row or a summary by groups. | Sin agrupar (filas de detalle) (no grouping, detail rows) or Agrupar por (group by) any of the fields. Default: no grouping. |
| Aggregate (only when grouping) | Which figure is calculated for each group. Add more with + Añadir agregado and remove with ×. | Recuento de filas (row count), Suma (sum), Media (average), Minimo, Maximo, % de filas con un valor (% of rows with a value). Sum, average, minimum and maximum also need the numeric field (— campo —). |
| Aggregate name | The title of that column in the result. | Text. Default: filas (rows) for the count. |
| Orden | Order: which column the result is sorted by. | Sin orden (no order) or a column. When grouping, the group or the aggregate. |
| Direction | Which way it is sorted. | Ascendente or Descendente. |
| Límite | Limit: the maximum number of rows shown. | Number. Default: 500. |
| Columnas (only without grouping) | Which columns appear in the detail. It expands with the dataset's list of columns, and the title says how many are shown, for example "15 de 15". | The dataset's columns. Default: all. |
Save#
| Field | What it does | Values |
|---|---|---|
| Nombre del informe | Report name, as it will appear in Informes guardados. | Text. |
| Visibility | Who sees the saved report. | Solo yo (only me) or Todo el proyecto (whole project). Default: Solo yo. |
| Guardar | Saves the current configuration under that name. | Button. |
| Nuevo | Clears the editor to start another report. | Button. |
How to#
Build a report by hand#
- 1
Pick the data
In Conjunto de datos, click the right one. Read the sentence underneath: it tells you what each row is.
- 2
Filter
Click + Añadir filtro and choose the field, the condition and the value. Repeat if you need more conditions.
- 3
Group if you want a summary
In Vista, choose Agrupar por and the aggregate, for example Recuento de filas.
- 4
Sort
Choose the Orden and the direction, and adjust the Límite if needed.
- 5
Run
Click ▶ Ejecutar. The result appears below, with how many rows are shown out of the total.
Ask for it in your own words#
- 1
Type what you want
In Pide el informe con tus palabras, for example "cuántas acciones vencidas hay por ubicación, de más a menos" (how many overdue actions there are per location, highest first).
- 2
Build
Click ✨ Montar informe. The app fills in the dataset, the filters and the view.
- 3
Check and adjust
Check the configuration before trusting the number: you can fix it by hand or ask for changes on top of what is there ("keep the top 5").
Export or save the result#
- 1
Export
With the result on screen, click Exportar CSV to take it to a spreadsheet.
- 2
Or save it
Type a Nombre del informe, choose Solo yo or Todo el proyecto and click Guardar. It will appear in Informes guardados.
Things to know#
- Reports belong to the project you are in. For another project, switch project.
- Some filter values appear as they are stored (for example "pendiente_aprobacion"), not with the label you see on other screens.
- Saving with Todo el proyecto shares the report in the project's Informes guardados. If it is a test, save it as Solo yo.
- The limit cuts the result. If the footer shows fewer rows than the total, raise the Límite before exporting.
Related#
- Analytics and reports: which panel answers each question.
- Actions Detail Report: the ready-made list of actions.
- Points Detail Report: the points economy, summarised.