What it is for#
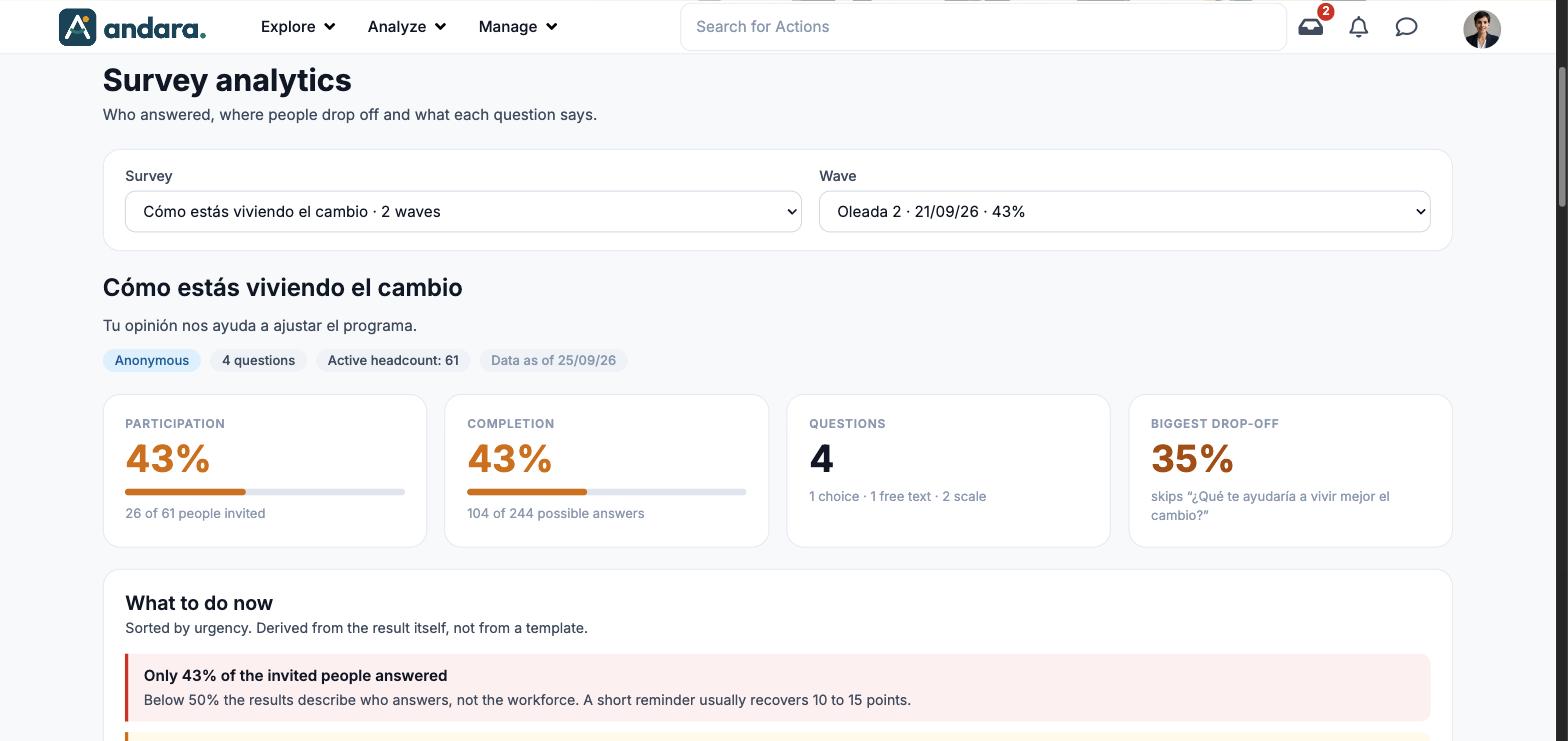
This is where you read what people answered in an anonymous survey, without names. The screen is titled Survey analytics and answers three questions: who answered, where people drop off and what each question says.
It loads by itself when you open it, with the first survey and its most recent wave. Below the figures, the screen itself suggests what to do.
Where it is: Analyze › Surveys Analysis › Anonymous Questionnaires.
What you see#
| Element | What it shows |
|---|---|
| Survey | Drop-down with the surveys and how many waves each one has. |
| Wave | Drop-down with All waves and each wave with its start date and participation. It only shows when the survey has more than one. |
| Survey summary | Name, description and tags: Anonymous, number of questions, Active headcount (active people in the project) and Data as of (date of the data). |
| Cards | Participation, Completion, Questions and Biggest drop-off (see Metrics). |
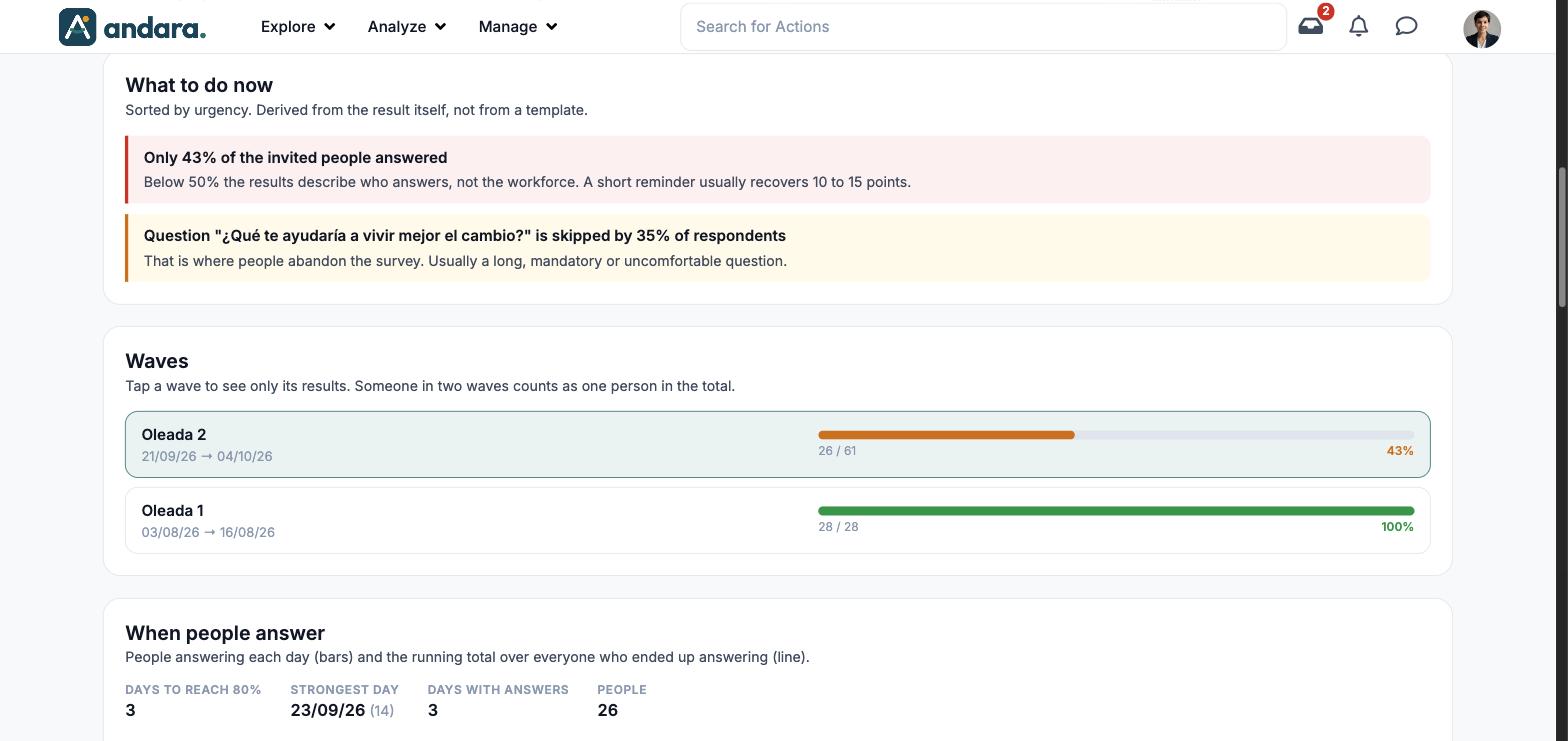
| What to do now | Recommendations "sorted by urgency", derived from the result itself. |
| Waves | One row per wave with its dates, people who answered over people invited, and the percentage. With a single wave the block is called The wave. |
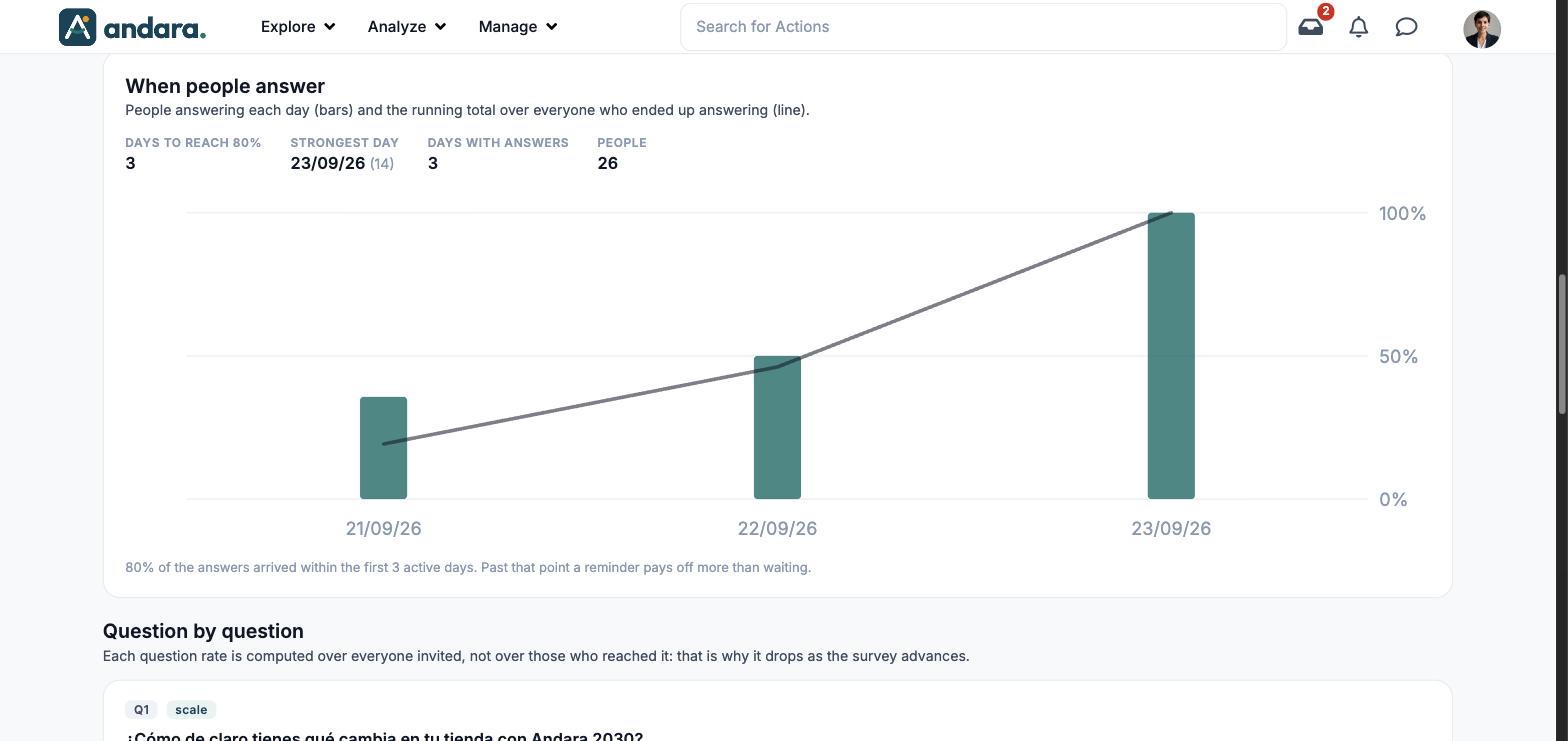
| When people answer | Daily answers chart with four figures on top. |
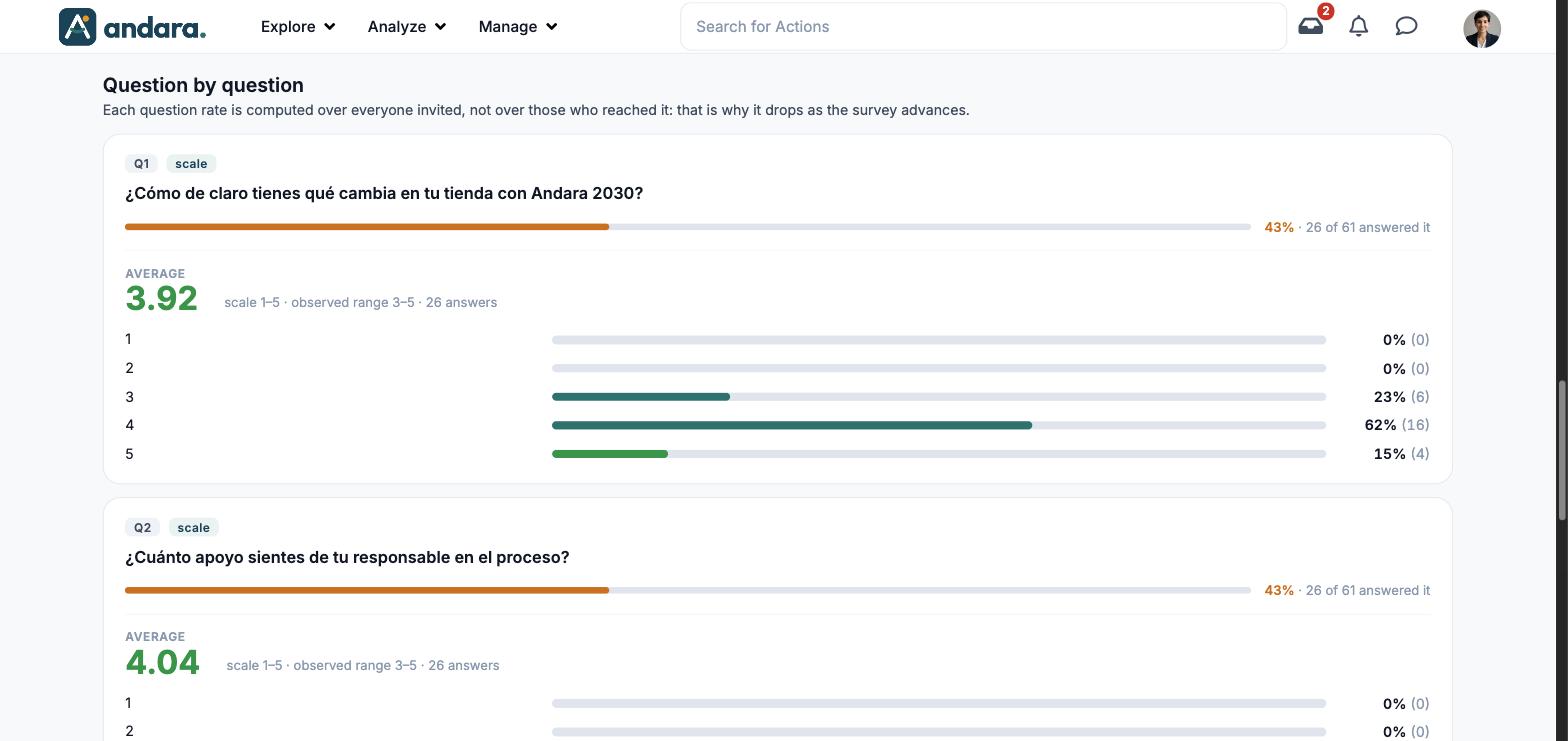
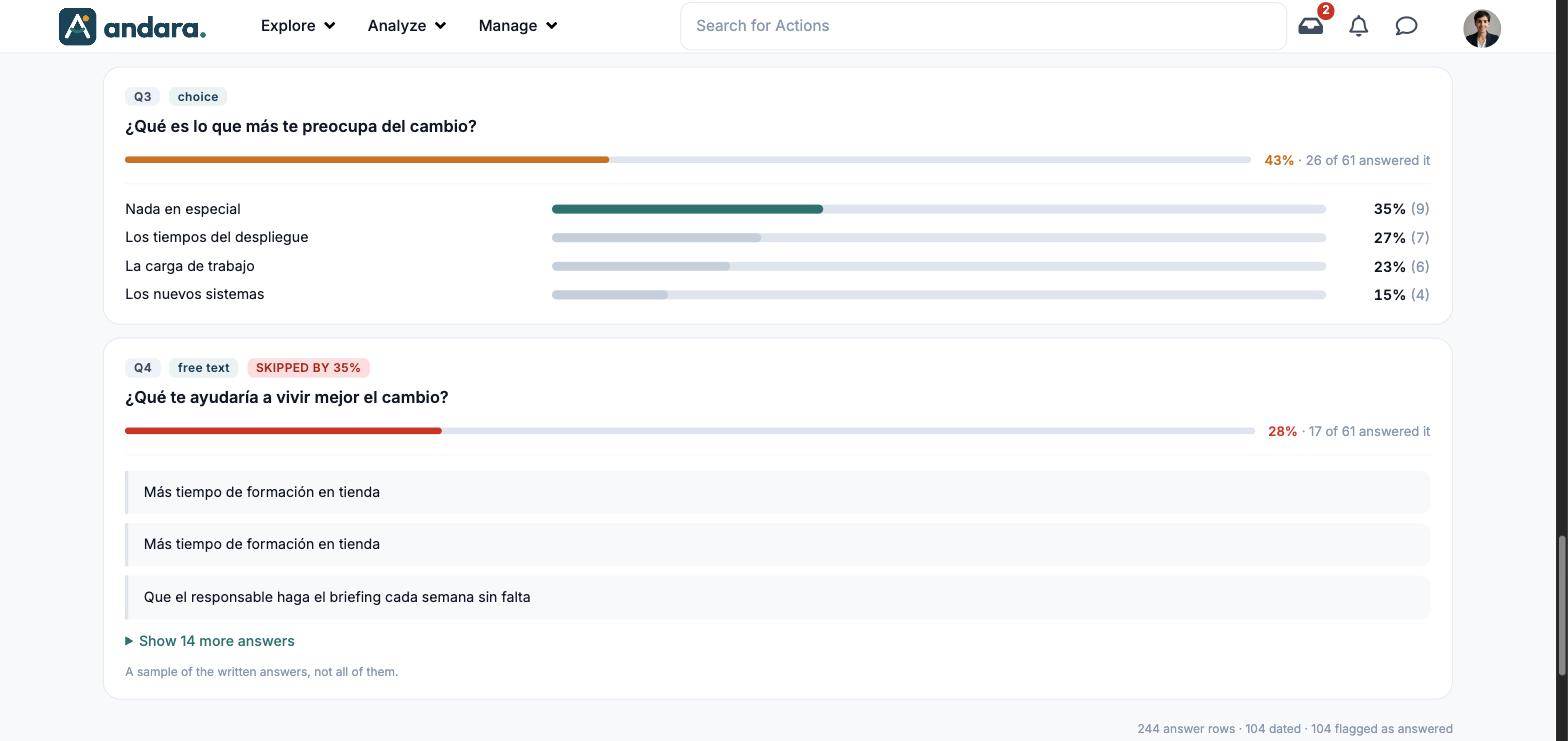
| Question by question | One card per question with its result. |
| Footer | Technical count of answer rows: how many, how many dated and how many flagged as answered. |
Metrics#
| Metric | What it measures | How it is calculated |
|---|---|---|
| Participation | What share of the invited people answered. | People who answered over people invited: "26 of 61 people invited". |
| Completion | What share of the possible answers was filled in. | Answered boxes over possible boxes (people invited times questions): "104 of 244 possible answers". |
| Questions | How many questions it has and of what type. | Count per type: choice, free text, scale. |
| Biggest drop-off | The question most people skip. | Share of respondents who leave that question blank. The question text is underneath. |
| Waves | How each launch did. | People who answered over people invited, and the percentage. Someone in two waves counts as one person in the total. |
| Days to reach 80% | How long it takes for most answers to come in. | Active days until 80 % of the answers are in. |
| Strongest day | The day with the most answers. | Date and, in brackets, how many people answered. |
| Days with answers | On how many different days someone answered. | Number of days. |
| People | How many people answered. | Number of people. |
| Daily chart | The pace of answers. | Bars: people answering each day. Line: running total over everyone who ended up answering. |
| Rate per question | How many people answered it. | Over everyone invited, not over those who reached it: that is why it drops as the survey advances. |
| Average (scale questions) | The question's result. | Mean of the answers, with the scale (for example 1–5), the observed range and the number of answers. Underneath, the split per value as a percentage and a count. |
| Split (choice questions) | What people chose. | Percentage and number of people per option, most chosen first. |
| Answers (free text) | What people wrote, without author. | A sample of the written answers, not all of them; Show N more answers expands the rest of the sample. |
Filters#
| Filter | What it does | Values |
|---|---|---|
| Survey | Picks the survey you are looking at. | The project's surveys, with their number of waves. Default: the first one. |
| Wave | Keeps one wave or puts them all together. You can also pick it by clicking a row in the Waves block. | All waves or a specific wave. Default: the most recent. |
How to#
Read a wave#
- 1
Pick the survey
In Survey, choose the one you want to read.
- 2
Pick the wave
In Wave, or by clicking its row in the Waves block.
- 3
Start with What to do now
The recommendations tell you whether participation is enough to draw conclusions and which question is making people drop off.
- 4
Go down to the questions
In Question by question, look at each question's average and split and read the written answers.
Compare two launches#
- 1
Look at the Waves block
Compare each wave's participation.
- 2
Switch waves
Click one and note the averages of the scale questions; then click the other.
Things to know#
- There are no names here. The survey is anonymous: the screen has no per-person view.
- Below 50 % participation, the results describe who answers, not the workforce, as the recommendation itself warns.
- Each question's rate is computed over the people invited, so it drops question by question even if nobody gave up halfway.
- The written answers are a sample. Not all of them are shown.
- All waves mixes the launches together. To compare, look at the waves one at a time.
Related#
- Survey results: anonymous versus named, and how to read the results.
- Nominal Questionnaires: the results screen with names.
- Surveys: where surveys are created and waves launched.