What it is for#
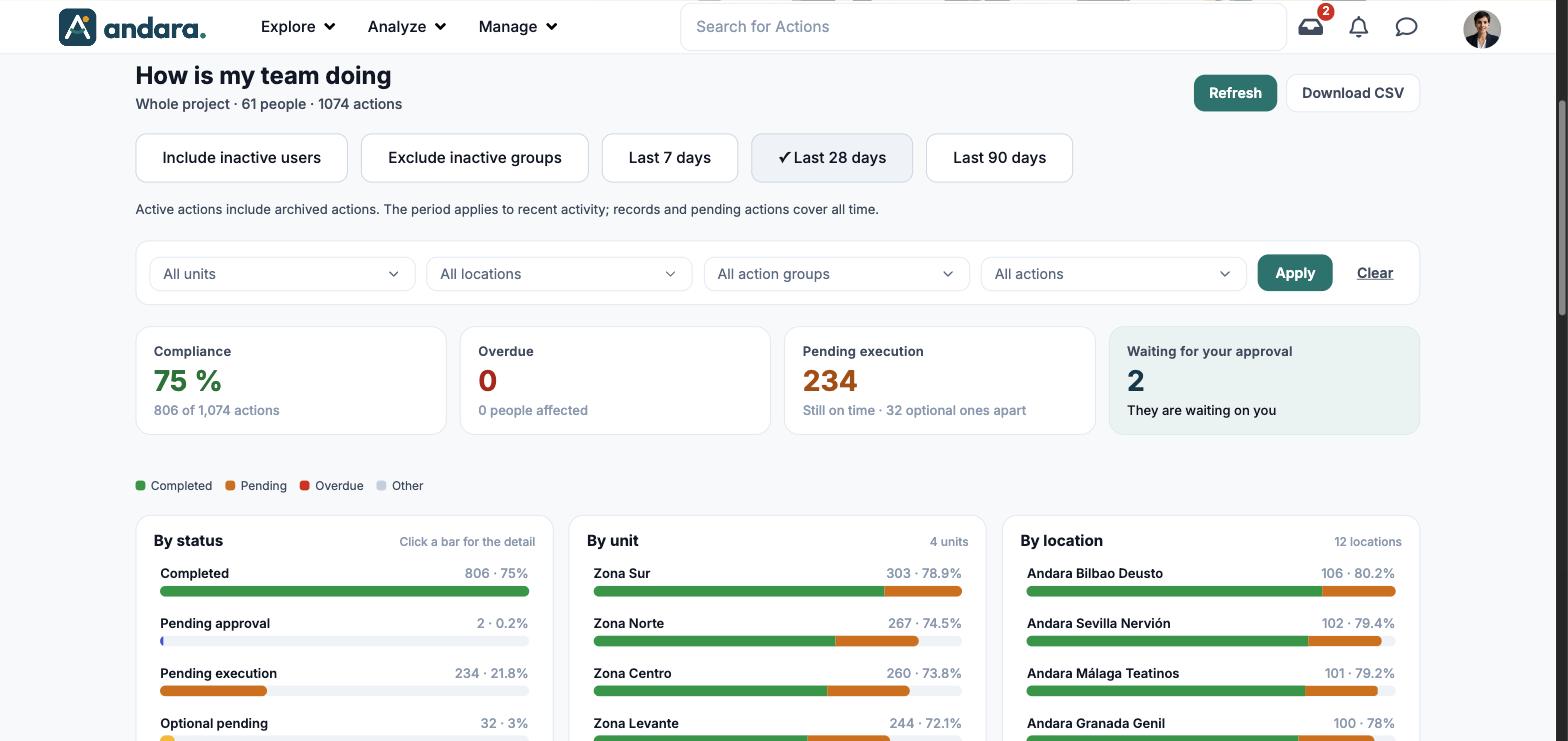
This screen tells you how much of the assigned work is already done and where the rest is stuck. At the top there are four headline figures, and below them six bar breakdowns: by status, unit, location, action group, action and due month.
Use it to decide where to look first. To get down to the people, click a bar: it opens the list of actions behind it.
Where it is: Analyze › Actions Follow-up › Aggregated Action Progress.
What you see#
| Element | What it shows |
|---|---|
| How is my team doing | The title, with the scope you are looking at underneath: Whole project, the number of people and the number of assigned actions. |
| Refresh | Requests the data again with the filters and period you picked. |
| Download CSV | Downloads the data as a file you can open in a spreadsheet. |
| Include inactive users, Exclude inactive groups | Toggles that widen or narrow the population (see Filters). |
| Last 7 days, Last 28 days, Last 90 days | The window for recent activity. The selected one has a ✓. |
| Note under the toggles | Reminds you that active actions include archived ones, and that the period only applies to recent activity: records and pending actions cover all time. |
| Headline cards | Compliance, Overdue, Pending execution and Waiting for your approval (see Metrics). |
| Legend | The bar colours: Completed (green), Pending (orange), Overdue (red) and Other (grey). |
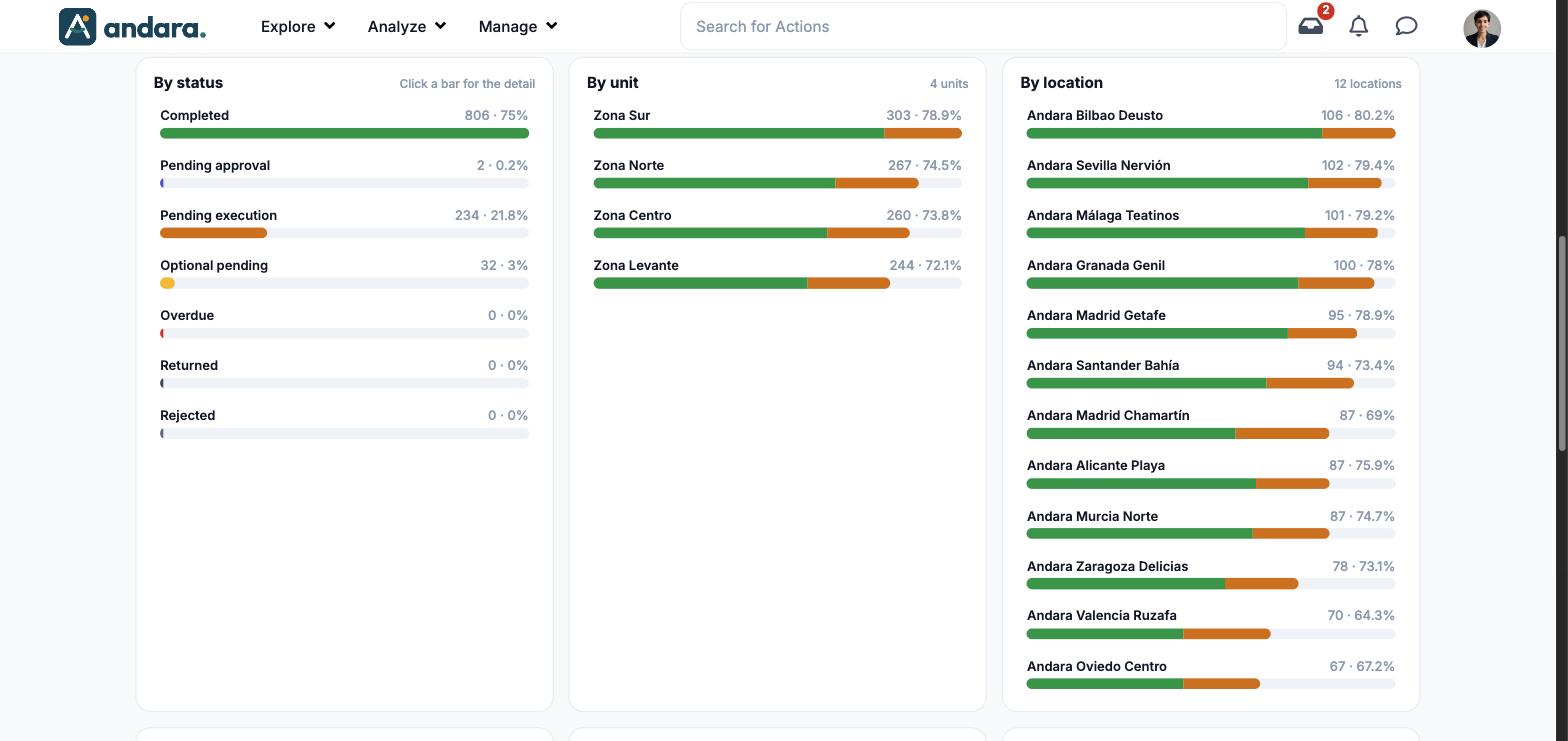
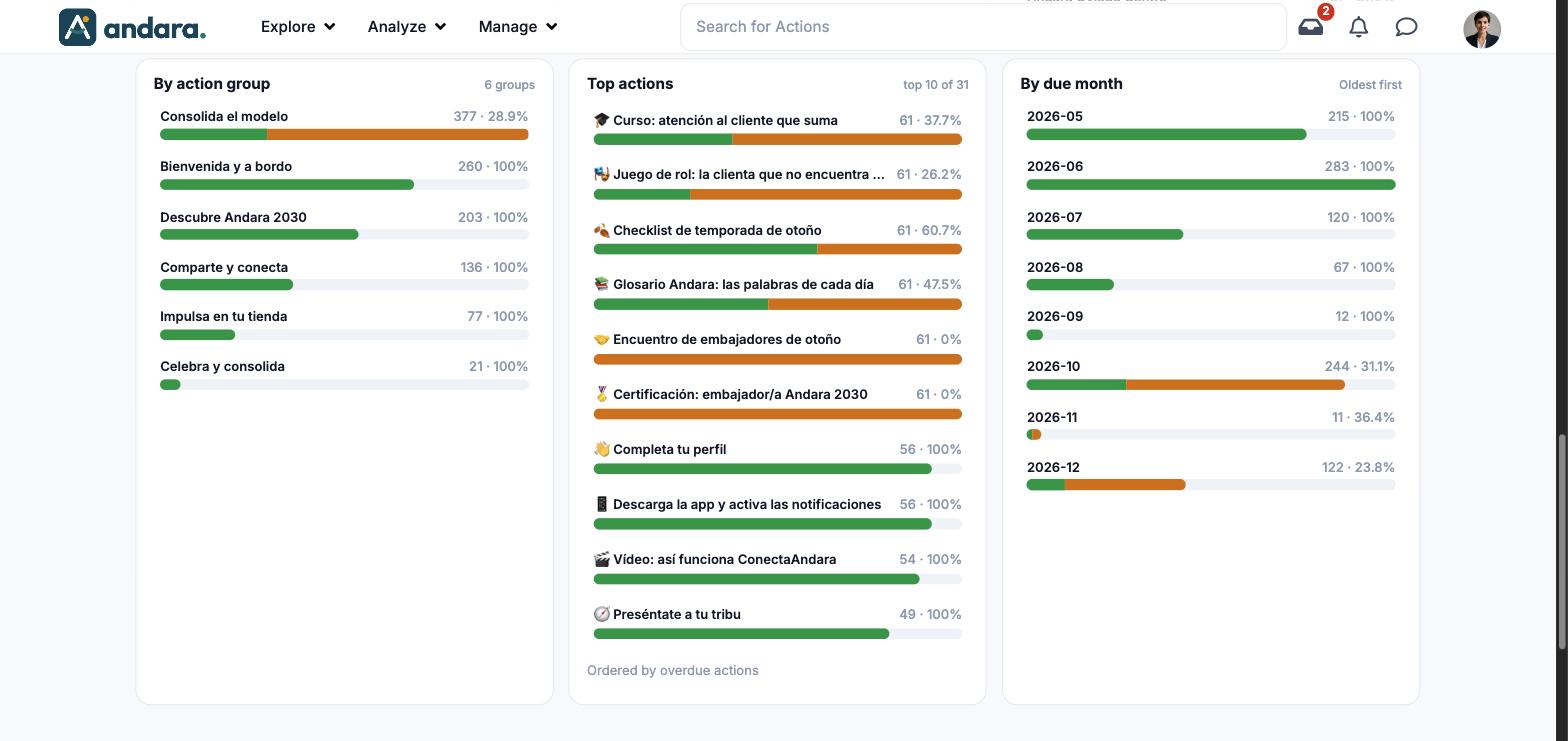
| Bar blocks | Six breakdowns. Each row shows the number of actions and a percentage next to it. |
Metrics#
| Metric | What it measures | How it is calculated |
|---|---|---|
| Compliance | How much of the assigned work is completed. | Completed over assigned, as a percentage. Underneath it says it plainly: "806 of 1,074 actions". |
| Overdue | Actions whose deadline has passed without being completed. | Number of actions. Underneath, how many different people are affected. |
| Pending execution | Actions the person still has to do and that are still on time. | Number of actions. Optional pending actions are counted apart ("32 optional ones apart"). |
| Waiting for your approval | Actions already handed in that are waiting for a manager's sign-off. | Number of actions. The card says They are waiting on you. |
| By status | How all assigned actions split between Completed, Pending approval, Pending execution, Optional pending, Overdue, Returned and Rejected. | Number of actions in each status and its share of the total. |
| By unit | Compliance for each unit of the structure. | Actions assigned to its people and the percentage completed. The bar splits green (completed) and orange (pending). |
| By location | The same per workplace. | Same as By unit. |
| By action group | Which block of the journey people get stuck in. | Actions assigned in the group and the percentage completed. |
| Top actions | The ten actions that get stuck the most, out of all the project's actions. | People who have it assigned and the percentage completed. Ordered by overdue actions, as the block footer says. |
| By due month | How much work falls due each month and how much of it is done. | Actions due that month and the percentage completed, oldest month first. |
Filters#
| Filter | What it does | Values |
|---|---|---|
| All units | Keeps the people in some units of the structure. | Drop-down with search. Default: all. |
| All locations | Keeps the people in some workplaces. | Drop-down with search. Default: all. |
| All action groups | Keeps the actions in some action groups. | Drop-down with search. Default: all. |
| All actions | Keeps some specific actions. | Drop-down with search. Default: all. |
| Apply / Clear | Recalculates the panel with the drop-downs you chose, or sets them back to "all". | Buttons. |
| Include inactive users | Counts the people who can no longer sign in to the app. | Toggle. Default: off. |
| Exclude inactive groups | Leaves out the actions of deactivated action groups. | Toggle. Default: off. |
| Last 7 days / 28 days / 90 days | The window for recent activity. It does not change records or pending actions, which cover all time. | Default: Last 28 days. |
How to#
See who is behind a bar#
- 1
Load the panel
Click Refresh and wait for the figures to appear.
- 2
Click the bar
In any block, click the row you are interested in. By status reminds you: Click a bar for the detail.
- 3
Read the list
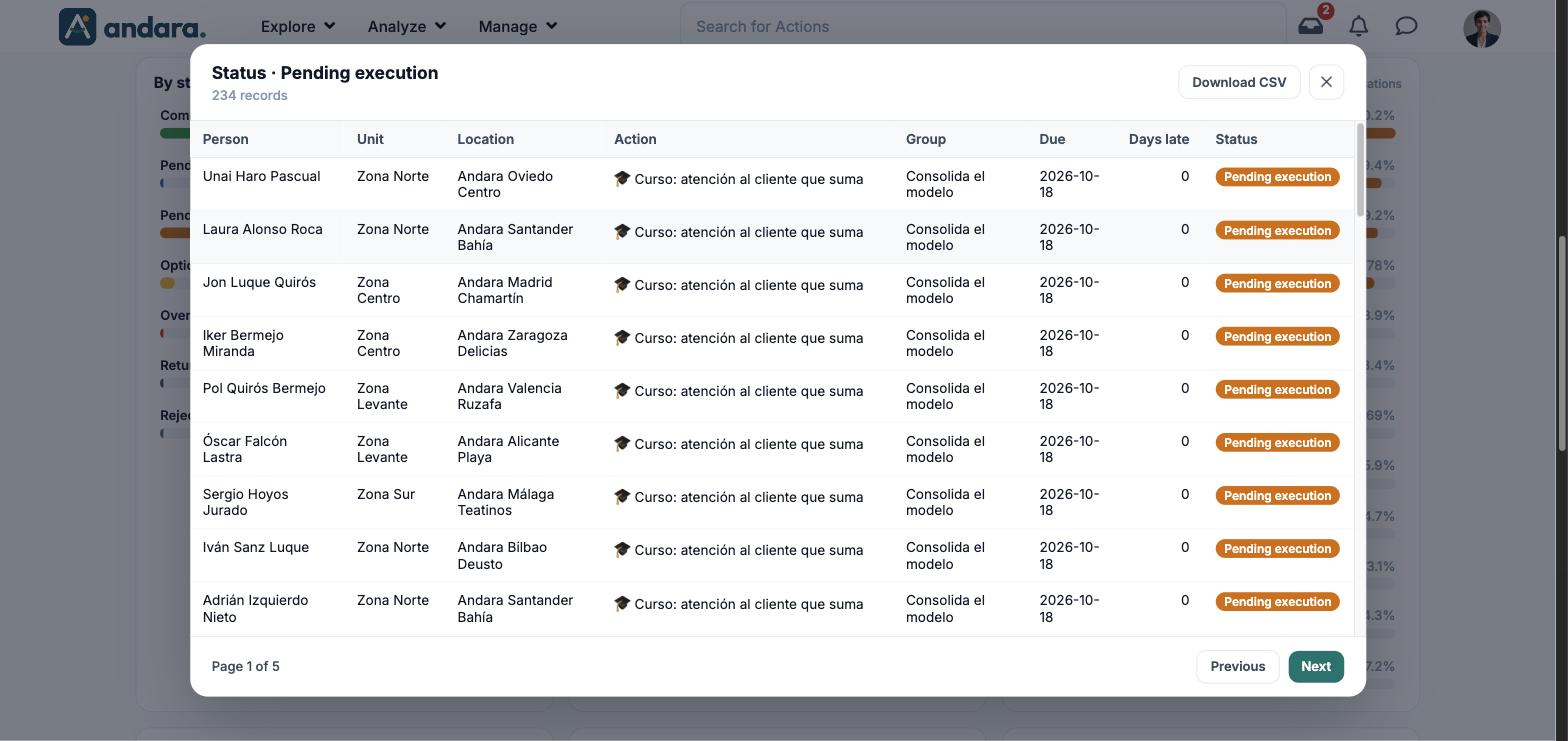
A window opens with the name of the slice (for example Status · Pending execution), how many records there are and a table with Person, Unit, Location, Action, Group, Due, Days late and Status.
- 4
Page through it or download it
Use Previous and Next to move through the pages. Download CSV downloads the list for that slice. Close it with ×.
Compare one part of the project#
- 1
Pick the slice
Choose what you want to see in All units, All locations, All action groups or All actions.
- 2
Apply
Click Apply. The header and every block are recalculated for that selection.
- 3
Go back to everything
Click Clear.
Things to know#
- The period only moves recent activity. Records and pending actions cover all time, so switching from 28 to 90 days does not change Compliance or the pending figures.
- Active actions include archived ones. If you archived actions people had assigned, they still count here.
- The number on each unit, location or group bar is actions, not people. Only Top actions counts people.
- The data is calculated when you click Refresh. If you have just approved some hand-ins, click it again before reading the figures.
Related#
- Detailed Action Progress: the named roster of each manager's team.
- Actions Detail Report: the flat list of every assigned action.
- The manager's panel and Analytics and reports.